
The Cato Institute published our comprehensive assessment of immigrants’ effects on government budgets over the last 30 years. My coauthors and I conclude that immigrants reduced deficits by about $14.5 trillion from 1994 to 2023. The Manhattan Institute (MI) published an article by MI fellow Daniel Di Martino—who has published two papers on this topic—that claims “our math doesn’t add up.” But the author did not do any math to refute our results.
Instead, MI misleads its readers about our methods, its methods, and the basic facts.
MI’s own study proves trillions of dollars in upside to immigration.
MI begins by asserting:
There is a rich literature that estimates the fiscal impact of immigrants in the United States and none—even the most pro-immigrant analyses—reach conclusions of a magnitude similar to Cato’s.… [I]mmigration can, under some circumstances, produce fiscal benefits, but those benefits are measured in tens of thousands of dollars—not the trillions implied by the Cato estimates. [my emphasis]
MI is using the fact that our work is the first-ever analysis of the fiscal effects of immigrants to cover the last 30 years against us. Naturally, no one can have found exactly what we found. We thought our novelty was good, but MI is clear: immigration cannot produce fiscal benefits in the trillions—or is it clear?
To prove the point, MI states that the National Academies found “the average lifetime fiscal impact of immigrants to be roughly –$23,000 in 2012 dollars.” This is wrong. This scenario estimated the net future fiscal value of immigrants in the country in 2013 over the next 75 years, so it excludes the taxes those immigrants already paid. It was also the worst-case scenario. In projections where Congress does anything to address the fiscal crisis it is barreling toward, the results were positive.
Looking at immigrants from the time that they arrive onward—the true lifetime effect—the net benefit ranged from a low of +$92,000 to a high of +$186,000 (Table 8–14). In 2026 dollars, that would be between $6 and $12 trillion in deficit reduction for another 50 million immigrants.
The Congressional Budget Office (CBO) estimated that just the illegal immigrants and asylum seekers who entered under President Biden (and their US-born children) would reduce the federal debt by between $700 and $900 billion over 10 years. The deficit savings rise to $167 billion annually in the tenth year. The CBO also found that immigration changes under President Trump will increase the debt by $500 billion over the next 10 years. These debt figures are from just a small subset of the 50 million immigrants in the United States, and only over 10 years. When extended, the deficit reduction (or increase) would easily reach the trillions over 20 to 30 years. MI should remember this report because it also criticized it (inaccurately).
In 2013, the CBO found that increasing population growth from immigrants and their children by 10 million would reduce deficits by about $900 billion over 20 years ($1.3 trillion in 2026 dollars). The same year, the conservative American Action Forum (AAF) found that immigration reform that increased population growth would reduce the federal deficit by over $2.7 trillion over 10 years. In 2015, AAF published a paper on mass deportation, reiterating and expanding on that conclusion, which MI has even cited. The Bipartisan Policy Center has a more recent analysis with findings of a similar scale.
But we don’t need to consult all these other studies. Di Martino’s own 2025 report for MI states:
The Cato Institute’s plan [to double immigration levels] would reduce the national debt by about $1 trillion in 10 years and $11 trillion in 30 years…. A legal immigration moratorium would increase the national debt by $567 billion over 10 years and by over $6.6 trillion over 30 years, all while causing an 8% economic contraction, increasing the debt-to-GDP ratio by approximately 22 percentage points. … [T]he immigration proposal of the [anti-immigrant] Center for Immigration Studies would shrink the size of the U.S. economy by over $3.3 trillion while adding nearly $5.5 trillion to the debt over 30 years.
Here is the graph of MI’s findings directly from its paper. Note that the y‑axis is in billions, so $10,000 equals $10 trillion.
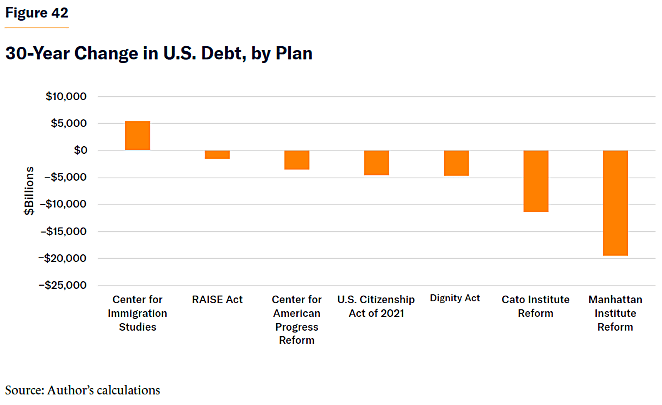
When MI states that everyone who has ever studied this issue has found immigrants cannot produce trillions in debt reduction, it ignores its own work. Of course, all these analyses are not apples-to-apples comparisons with Cato’s work, but MI cites its work to suggest that Cato’s work is too “implausible” to be believed. Instead, they show the opposite. And remember all these studies are projections of future budgets with far more spending and lower taxes assumed than the actual budgets of the 1990s and 2000s—the period covered by Cato’s analysis—so as a starting point, there is nothing implausible about immigrants reducing deficits by trillions.
MI’s analysis proves the fiscal upside to immigration.
MI then turns to our finding that the average immigrant had a positive net fiscal effect of $10,349 in 2013. Citing data from the Census’s Current Population Survey (CPS) that the average income for immigrants (including children, the unemployed, and retirees) was $25,000, it comments:
A group earning $25,000 annually cannot plausibly reduce the national deficit by $10,000 per person. That would imply tax payments approaching 40 percent of income, even after accounting for government transfers.
It admits that the CPS shows net positive federal tax payments of $1,900, which at least confirms our analysis is directionally correct: immigrants reduce the deficit. But MI’s analysis is fatally flawed.
- First, it compares our 2013 finding, expressed in 2024 inflation-adjusted dollars, with nominal income and taxes in 2013.
- Second, MI only includes federal Social Security and income taxes. This excludes about 30 percent of federal revenue—corporate, excise, Medicare supplemental payments, tariffs, and non-tax fees and revenues—and most federal, state, and local revenues. MI inaccurately claims that these revenues are only 10 percent of federal revenue and that non-federal revenues don’t matter, but in fact, state and local revenues accounted for 44 percent of immigrants’ net fiscal effect in 2013.
- Third, as the National Academies study cited by MI discusses, the Current Population Survey famously underreports earnings and taxes. MI says tax payments of $10,000 are impossible with incomes of $25,000, but the actual amount of per capita taxes in 2013 was over $15,000 with an average income of just $22,700—lower than the $25,800 for the immigrants—using CPS’s narrow definition of earnings and the underreporting. In reality, per capita personal income was $44,520 and per capita GDP was $53,400 in 2013 dollars. Tax payments have consistently accounted for about 27 percent of GDP.
MI should agree with this because its paper also estimates that earnings are less than half of a person’s effect on GDP, so its comparison between CPS-measured income and CPS-measured taxes is misleading.
The chart below shows the actual per capita values for taxes and spending in 2013, compared to actual personal income and GDP per capita. It shows that the Manhattan Institute does not account for most tax revenues in its example. These aren’t estimates or survey results. These are the real numbers from the Bureau of Economic Analysis’s National Income and Product Accounts. Check for yourself. Given that immigrants’ earnings are higher than the average, it would be difficult for immigrants not to be more fiscally favorable than the average person.
Everyone who does this work—the National Academies, Congressional Budget Office, the Cato Institute, among others—all use the total amounts of income, taxes, and spending from administrative records—the true totals—and then use the survey only for the immigrant-versus-native distribution. The fact that MI does not take this step invalidates its prior studies on this issue by excluding a significant amount of revenue.
A better way to intuitively understand our conclusions is to start with the aggregate numbers. In 2013, the average per capita GDP was $53,400, and per capita government revenue was $15,643. Average per-capita benefits were $13,082, after accounting for fixed costs like payments on past debt and the US military, so the average marginal person paid about $2,558 more in taxes than they received in benefits. “Benefits” in our report include everything from welfare and policing to parks and roads (contrary to what MI states in its criticism).
Were immigrants better than average? Unambiguously yes. As already noted, immigrants had higher per capita incomes, which translated into higher per capita revenues ($17,307 versus $15,396). These taxes widen the average net effect to $4,224. When we account for how many fewer benefits immigrants receive, the effect nearly doubles to $8,000—or $10,000 in 2024 dollars.
Our study identifies the two main sources for these savings: fewer retirement and education costs. Immigrants are half as likely to be in schools, saving on education spending, and they draw much less from Social Security (because many are ineligible due to insufficient work history or legal status) and public pensions (because they are half as likely to work for the government). MI does nothing to refute these findings.
MI provides a false theory for Cato’s result.
Instead of refuting our findings, MI tries to explain our results by stating the following:
By limiting their analysis to the years 1994 to 2023—the period of fastest growth in the foreign-born population in U.S. history—Cato captures the period when most immigrants were at an age that generated revenue, while largely omitting the future entitlement spending owed to a greying population.
First, we limited our analysis to 1994 to 2023 because the data series starts in 1994, not because we cherry-picked a favorable date. Second, we tested MI’s theory that its young workers entering that maintained the positive net effect, and it’s not true. Immigrants were not significantly underrepresented in the retiree population during this time. Immigrants averaged about 12 percent of the population from 1994 to 2023, while they were 11 percent of the over 65 population. They used 34 percent fewer retiree benefits because they were less likely to qualify for public pensions and because they were subject to unique eligibility limits for Social Security and Medicare.
Third, we tracked a specific cohort of immigrants who entered from 1990 to 1993 throughout the period to see if it is new workers entering that drive our results. In fact, the average immigrant in the 1990 to 1993 cohort was more fiscally positive than the average immigrant ($11,064 versus $9,572 per immigrant overall), despite having lower educational attainment than the other cohorts. If MI had read our paper, it would know these facts. They are prominently highlighted.
In Part 2, I will discuss MI’s trivial, inaccurate, and bad-faith methodological criticisms and why Cato’s model is extremely conservative.
Read that here: Manhattan Institute’s Criticisms Vindicate Cato’s Report on the Fiscal Effect of Immigration: Part 2