

April 2025 marks the 50th anniversary of the publication of Yale University economist William D. Nordhaus’s “The Political Business Cycle” (April 1975) in The Review of Economic Studies. This important article not only formally defined a new exogenous hazard to market performance at a time when markets were repeatedly denigrated as inherently unstable, it identified intrinsic tendencies in democratic political systems to manipulate the performance of economies to the benefit of incumbent politicians, especially to influence elections for the retention of political power.
The term political business cycle traces back at least to Polish Marxist and admirer of John Maynard Keynes, Michał Kalecki. Kalecki’s cycle (1943) runs as follows: a government borrows to achieve full employment (what Kalecki calls a “synthetic boom”) and runs a budget deficit. Business leaders rise up against this and lobby the government to reduce or eliminate the deficit. The reduction or elimination of the deficit causes a recession, which is then only cured by a resumption of government deficits and debt.
Why are the captains of industry supposedly such ferocious deficit hawks? According to Kalecki, “capitalist ethics require that ‘you shall earn your bread in sweat’” and the “class instinct [of the captains of industry] tells them that lasting full employment is unsound from their point of view, and that unemployment is an integral part of the ‘normal’ capitalist system.” Does Kalecki offer any evidence for this theory? No, it’s a requirement of Marxian class analysis: employers hate their employees and seek to oppress them economically and socially.
Where is the evidence that reduced government deficits increase unemployment? According to Kalecki, it lies in the 1937 recession in the US. In the first part of 1937, the economy boomed; in the second—because the deficit was reduced—the economy fell into a recession. Of course, today we know that—contrary to Kalecki—it was the government’s disastrous fiscal and monetary policies that returned the economy into its second steep downward swing of the misnamed “Great Depression”—actually two depressions separated by a weak recovery that extended from about 1934 to 1937. There was no boom in 1937, unless you think that moving from an unemployment rate of 16.9 percent in 1936 to an unemployment rate of 14.3 percent in 1937 constitutes a “boom.”
Thankfully, the prospects for the political-business-cycle concept improved substantially after the Marxo-Keynesian incoherence of Kalecki. Johan Henrik Åkerman (1947) found that in the US, from about 1830 to 1945, cycles of economic activity correlated with the four-year-long presidential election cycle. Anthony Downs (1957) held that politicians “act solely in order to attain the income, prestige, and power which come from being in office.” (p. 28). Politicians, “by means of economic and other actions, [attempt] to manipulate both present and future utility pay-offs to voters in a way that will win their votes” (p. 176).
However, no one’s work promoted the term “political business cycle” and the idea of incumbent politicians manipulating the economy for the retention of political power as that of William Nordhaus. In the half century since its publication, there have been so many academic discussions, symposia, and journal articles and comments on his model that all of their citations would be only slightly less difficult to count as to locate and read. What is clear—after reading dozens of these works—is that many, if not most, scholars became oblivious as to what Nordhaus’s ultimate solution to the political business cycle was and likely one of his main motives for undertaking his study.
The Model in Brief
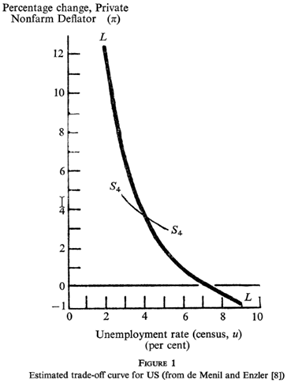
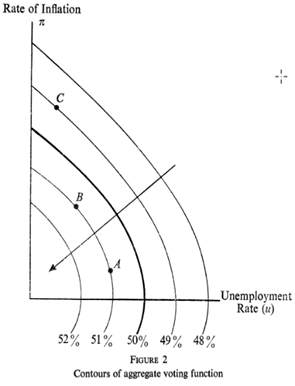
Without getting too technical, the first main component of Nordhaus’s model was the Phillips curve, the Keynesian tradeoff between unemployment and inflation. Nordhaus posited two versions of the curve—short-run and long-run—and they appeared as illustrated in Figure 1 below. The second main component was a social-welfare voting function (Figure 2 below) which was maximized when increasing proportions of the voting public supported policies that minimized both unemployment and inflation. The short- and long-run Phillips curves were then superimposed onto the social-welfare voting function to derive the full model (Figure 3 below).
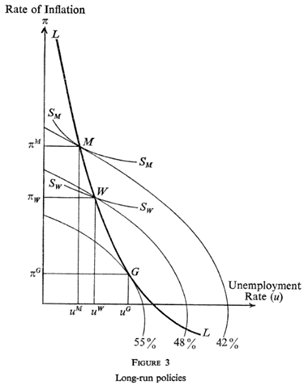
The point of the full model (Figure 3) was that—given the Phillips curves and assumptions about the voting public—democracies in the long run steer toward lower unemployment and higher inflation than optimal. In other words, point M (for “myopia”) or higher up the long-run Phillips curve (LL) in Figure 3 is where the public would guide the economy, even if governments have to run deficits and accumulate large debts (to the detriment of future generations) in order to reach and maintain “full employment.” Point M and above (on LL) were preferred to a point such as G (“golden rule”) because while inflation at point G is relatively low, unemployment is relatively high.
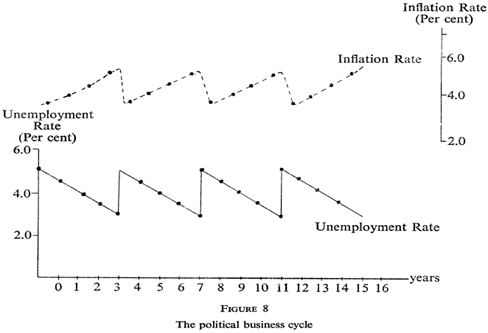
Under the more realistic assumption of variable economic policy during electoral periods, what we would then get from the political class are repeated cycles resembling this:
- As each election approaches, unemployment will steadily fall until, on election eve, there is full employment but inflation is raging (myopia).
- Immediately after each election, the winning politicians will raise unemployment to fight inflation but steadily reduce unemployment through the next election eve. Rinse, repeat.
Here’s the pattern across four four-year terms with realistic hypothetical data for the US (Figure 8):
Empirical Evidence
What Nordhaus found in annual unemployment rates for 1947-1972 for nine countries (Australia, Canada, France, Germany, Japan, New Zealand, Sweden, UK, and US) was no evidence of cycles in Australia, Canada, Japan, and UK; some evidence of cycles in France and Sweden; and clear evidence of cycles in Germany, New Zealand, and the US.
For the US, full cycles were found during the presidencies of Harry Truman (1948 incumbent, 1952 de facto incumbent) and Eisenhower (1956 incumbent). Half cycles were found for Johnson (1964 incumbent), Humphrey (1968 incumbent), and Nixon (1972 incumbent).
The big problem for Nordhaus’s model was that the Phillips curve began completely unraveling the year before his article was published. The short-run curve—lower unemployment leads to higher demand leads to higher prices—was always more theoretically sound than the long-run curve—higher inflation leads to expectations of higher inflation, which leads to workers demanding higher wages.
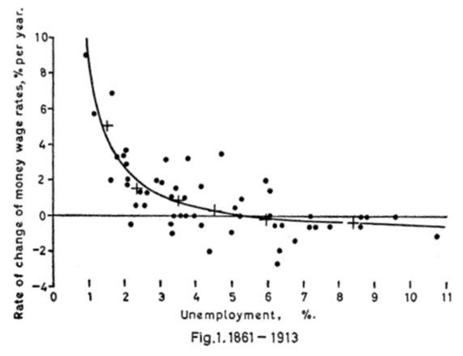
The original scatterplot, drawn by A.W. Phillips (1958), for the unemployment and inflation rates in the UK for 1861-1913 appeared as follows:
From the US 1982 Economic Report of the President (1961-1981, p. 51, with data for the years 1982-1985 added), we see the function’s gradual breakdown in the mid-1970s:
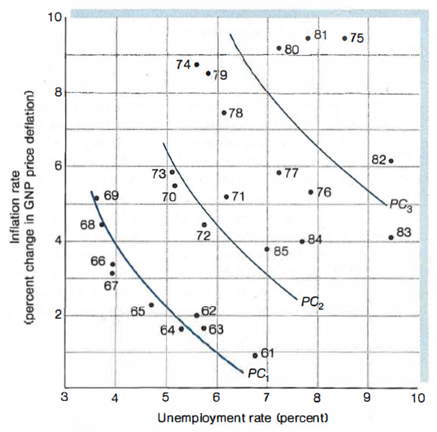
For the years 1961-1969 (PC1, the Phillips curve furthest to the left in the diagram above), there is a very clear and even tight negative relationship. For the years 1970-1973, the remnants of a tight relationship survive, although shifted rightward (PC2). The relationship began falling completely apart in 1974, with a coordinate point (5.5 percent unemployment rate, 8.8 percent inflation rate) way above and outside those of all previous years. Then—to the even greater horror of the Keynesians—there was 1975 (8.5 percent unemployment rate, 9.4 percent inflation rate), and 1976 (7.8 percent unemployment rate, 5.3 percent inflation rate).
Steven Landsburg (1993) on the fate of the Phillips curve:
Inflations fool workers into accepting more jobs and employers into hiring more workers. Governments notice that inflation is consistently accompanied by high employment and decide to take advantage of this relationship by systematically manipulating the inflation rate. Workers and employers quickly notice what the government is up to and cease to be fooled. The correlation between inflation and unemployment breaks down precisely because the government attempts to exploit it. (p. 217)
Almost completely overlooked was Nordhaus’s proposals (pp. 188-189) for ending political business cycles. There were five, but only the first and last are notable. The first: improve the flow of information available to voters: “When the transmission and reception of information is cheap, this is probably a sound policy; for with proper information about the long-run trade-off, both the long-run bias and the political business cycle disappear” (p. 188). This was rejected because the public just isn’t smart enough: “On the other hand, it is clearly unrealistic to ask each citizen to carry a full-scale econometric model of the wage-price-unemployment nexus in his head. We question the practical possibility of the ‘classical’ solution in such complicated matters” (p. 188).
This was clearly wrong: since the explosion of the World Wide Web in 1995 and Internet and social media later, the idea of incumbent politicians juicing up the economy in the months leading up to an election is now much discussed on business shows, Facebook, and X, and certainly was in the months before the 2024 presidential election. Fox Business Network host, Larry Kudlow, accused Fed chair Jerome Powell of cutting interest rates in September 2024 to help Democratic presidential candidate Kamala Harris defeat Republican Donald Trump. Accusations have even been made well past the election, as Fox Business correspondent Charles Gasparino on March 12, 2025 accused the Biden administration of spending $300 billion to help Harris defeat Trump.
Nordhaus’s second notable proposal was a version of European-style planning in the sense of governments negotiating with their opposition, labor, management, and other political and economic interests. The planning process, he reasoned, would make it much more difficult for governments to persuade other interest groups to accept a plan that involved the creation of a political business cycle. After all, he found the highest cyclical variability in the unplanned economies of US, Canada, Japan, and West Germany, and the least variability in the planned economies of France and Sweden. Therefore, planning was his preferred solution.
The problem? Nordhaus’s own data didn’t find any evidence of cycles in Canada or Japan (see above). But, in the fog of time over the past half century, as scholars (so many always missing the forest in their obsession over a tiny sliver of tree bark) discussed his work and got caught up in a manic frenzy over expectations-augmented Phillips curves, iso-vote curves, infinite implicit rates of time preference, and arguments over whether rational expectations sunk political business cycles, they missed that his study—far from being a warning about the self-serving behavior of the political class—was really an argument for French or Swedish-style planning. Had the US gone this route, unquestionably it would be in much worse shape today.
What happened to Nordhaus over the last half century? He had one other major problem after the dust cleared in the wake of the collapse of the Phillips curve. Even appearing to insinuate that politicians and civil servants were not the selfless angels of highest moral probity of progressive religious dogma was not exactly a congenial idea at the cocktail parties and high conclaves of Yale and New Haven. For permanent prestige and fame, he needed a much more palatable Second Act, and struck gold by fathering climate-change economics and riding the new discipline to a Nobel prize in 2018. Despite briefly revisiting the topic in 1989 (“Alternative Approaches to the Political Business Cycle”), memories of possible thoughtcrime committed in the mid-1970s faded considerably. It was as well-played as an exquisitely timed political business cycle.


